Tools and Techniques
Conducting Analysis
The next step in problem solving is to “make sense” of information collected in previous step. There is an abundance of analytical techniques that can be applied for understanding:
- Benchmarking: What performance areas are weak?
- SWOT: What are the core competencies of the client?
- Force Field Analysis: What forces can influence the problem?
- Pareto Analysis: What are the most important issues?
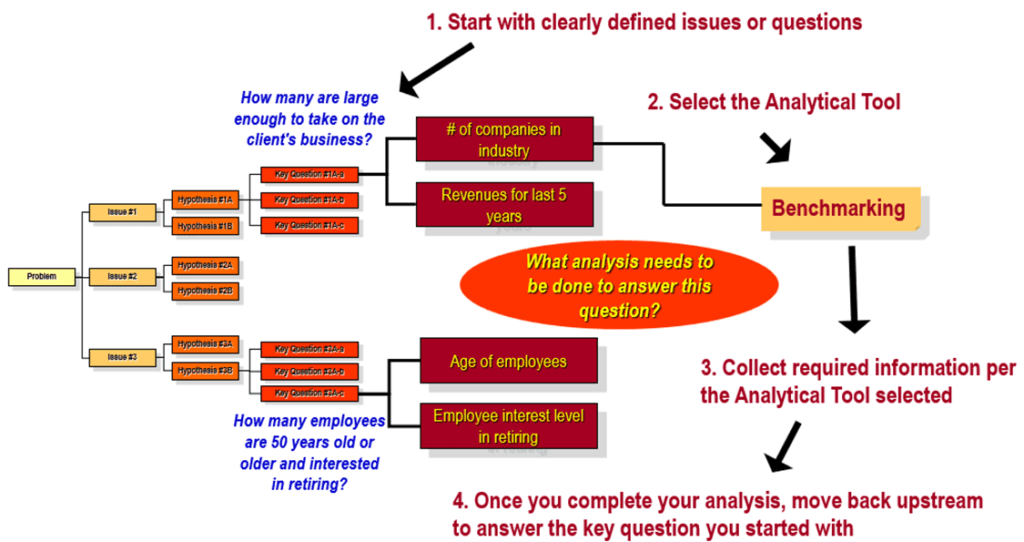
Specific Sequential Steps that lead up to the Analysis:
- Make sure you know what you are trying to solve – Clearly defined issues or questions drive the analysis!
- Match up the clearly defined question or issue with the appropriate analytical tool(s)
- Once you’ve matched up the analytical tools against the question or issue, then go out and collect the facts.
Apply analytical tools and move back upstream
Analytical techniques
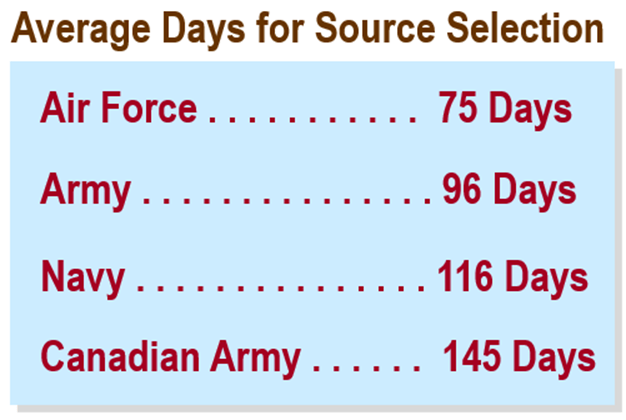
1. Benchmarking – Compare and measure a process or activity against an internal or external source
Benchmarking is a method that assesses and contrasts your performance with similar activities or processes, both internally and externally. Discrepancies can highlight potential performance issues, though gathering comparable data may pose challenges. It’s more beneficial to compare against “best in class” performance rather than average performance. In the private sector, notable sources for benchmarking data include Hays Benchmarking, Benchmarking Exchange, and The Benchmarking Exchange.
Benchmarking Example
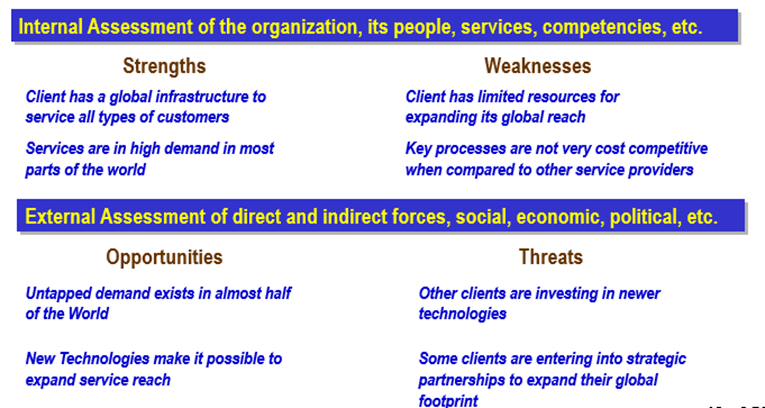
2. SWOT Analysis – Assessment of Strengths, Weaknesses, Opportunities, and Threats
SWOT analysis is a widely used strategic planning tool that evaluates an organization’s Strengths, Weaknesses, Opportunities, and Threats. It involves assessing what the organization excels at, where it falls short, potential opportunities, and potential risks to avoid. SWOT analysis is a common and relatively simple tool, though its subjective nature makes it easy to understand and apply. It proves especially valuable in identifying an organization’s core competencies.
SWOT Example
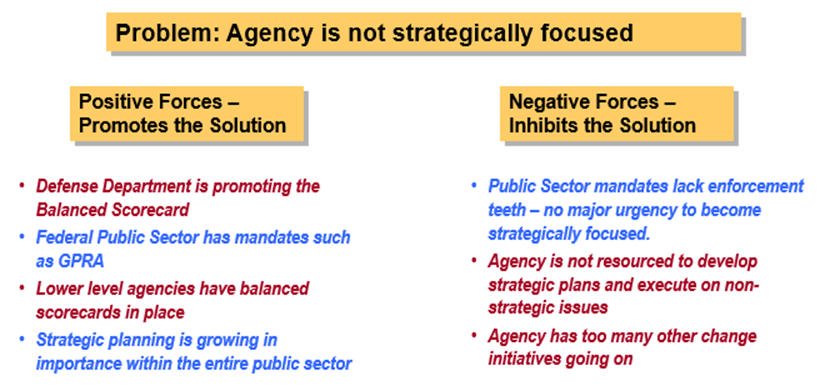
3. Force Field Analysis – Overall environmental landscape and how it impacts the subject
Force Field Analysis visually represents key factors influencing a problem, including those supporting or hindering a solution. These forces are categorized as direct (more crucial) or indirect (less significant), allowing for prioritization. Brainstorming may be necessary to identify and list all relevant forces impacting the situation. Force Field Example
4. Cost Benefit Analysis – Compare total equivalent costs (all the minuses) against equivalent value in benefits (all the pluses)
Cost-Benefit Analysis involves identifying anticipated costs and benefits to ensure the economic viability of a decision. Costs encompass tangible expenses like time and money, as well as intangible factors with assigned values. It emphasizes comparing comparable elements using a set of decision criteria and assessing the net changes resulting from making or not making the decision. In the Federal Public Sector, guidelines for conducting cost-benefit analysis can be found in the Office of Management and Budget Circular A-94.
5. Impact Analysis – What if type analysis to assess the impact of change on an agency
Impact Analysis involves identifying extensive and varied effects associated with a problem or its proposed solution. It addresses questions such as the impact on the agency and the consequences of not addressing the problem. The objective is to minimize adverse outcomes and negative impacts. Impact analysis is especially valuable in assessing the risks associated with various proposed solutions, aiding in the selection of the most suitable course of action. Multiple tools can be utilized to assess these impacts.
Impact Analysis Tool:
- Scenario Playing – Storyboarding out how the future will unfold between alternatives: Do Nothing vs. Solution
- Cost Benefit Analysis – Used to quantify impacts
- Decision Tree Analysis – Build a tree and assign probabilities to each alternative to arrive at the most likely solution
- Simulation – Modeling a process and seeing how it changes when one or more variables change
- Prototype Model – Build and test the solution on a small scale before implementation to flush out lessons learned
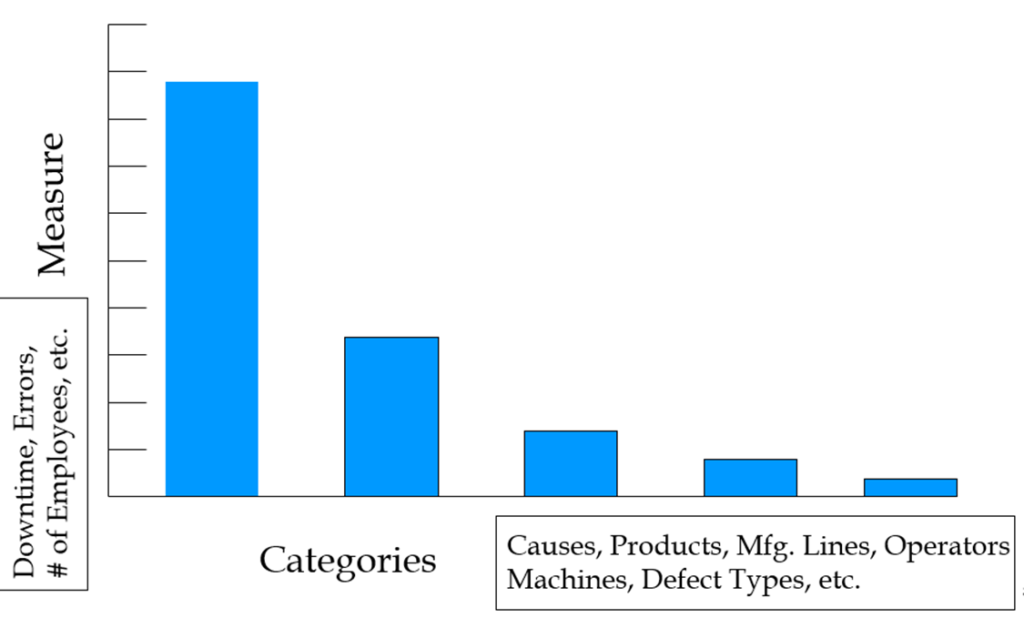
- Pareto Chart – Bar Chart for categorizing issues or other attributes in terms of importance. The 80/20 Rule, represented through a bar chart, quantifies the most crucial aspects by emphasizing the significant problems or issues. To apply this rule, problems or issues are grouped based on a common measurable attribute, such as reworks or errors (Left Vertical Axis). They are also categorized by type (Right Horizontal Axis), such as poor quality or long wait times. The data is then plotted and ranked in descending order from left to right according to frequency, highlighting the most impactful issues.