
Various BI Tools
Some of the tools BI professionals use are for:
Pipelines, ETL Tooling and Database Platforms: BI teams use data tools to source data at scale, quality check information, prepare data for various use cases and store data.
Data Mining Tools: Business intelligence teams may spend a good deal of time mining data by way of manual queries or reporting tools that query predefined databases in order to present business insights.
Data Visualistaion Tools and Software: Business intelligence teams make use of data visualization tools to present data and trends in an accessible format. Data visualization is often used by BI teams to provide the business with self-service information.
Spreadsheets: Spreadsheets continue to be a key component of BI work. They’re flexible tools with a wide variety of features that BI teams can use in a sophisticated way. Spreadsheets are a valuable tool because they don’t require in-depth specialist training, which means they’re accessible to many functions within a corporation.
Reporting Softwares: BI teams and functions are often responsible for corporate and regulatory reporting. Business intelligence teams will often use software or formalized reporting tools to provide these outputs.
Various Business Intelligence Tools are:
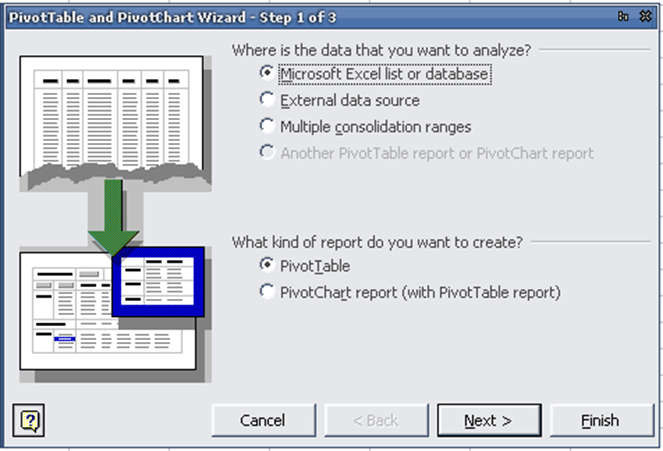
- Pivot Table: A Pivot table is a great reporting tool, that allows for slicing and dicing data.
- Tableau: Tableau is a popular data visualization tool known for its intuitive interface and powerful visualization capabilities. It allows users to create interactive dashboards, charts, and reports from various data sources.
- Power BI:Power BI is a suite of business analytics tools that enables users to visualize data, share insights, and collaborate in real-time. It offers a wide range of features, including data modelling, interactive dashboards, and AI-powered analytics.
- QlikView/Qlik Sense: QlikView and Qlik Sense are data discovery and visualization tools that allow users to create interactive dashboards and explore data from multiple sources. They use associative data modelling to enable users to uncover insights and make data-driven decisions.
- IBM Cognos Analytics: Cognos Analytics is an enterprise-grade BI platform that provides a comprehensive set of tools for reporting, analysis, and dashboarding. It offers features such as AI-driven analytics, predictive modelling, and natural language processing.
- MicroStrategy: MicroStrategy is a powerful BI platform that provides advanced analytics, mobility, and security features. It enables users to create interactive dashboards, conduct ad-hoc analysis, and distribute insights across the organization.
- SAP BusinessObjects: SAP BusinessObjects is a suite of BI tools that includes solutions for reporting, analytics, and data visualization. It integrates with SAP and non-SAP data sources to provide comprehensive insights into business performance.
- Google Data Studio: Google Data Studio is a free data visualization tool that allows users to create interactive reports and dashboards using data from various sources, including Google Analytics, Google Sheets, and Big Query.
- Looker: Looker is a cloud-based BI platform that offers data modelling, exploration, and visualization capabilities. It enables users to create custom metrics, conduct ad-hoc analysis, and share insights across the organization.
- Domo: Domo is a cloud-based BI platform that provides a wide range of features, including data integration, visualization, and collaboration. It allows users to create interactive dashboards, track KPIs, and share insights in real-time.
- Sisense: Sisense is a BI platform that specializes in complex data analysis and visualization. It offers features such as data preparation, AI-powered analytics, and embedded analytics for integrating BI into applications and workflows.